
You've been sitting for a few hours already and you're only halfway through your company's profile. Your head is starting to hurt and you're in desperate need of caffeine. It seems to be taking way too long to talk about how each apartment community is faring.
Does this sound similar to how most of your team meetings go?
There are many different measurables multifamily companies use to evaluate the success of their apartments, but they can get confusing and fail to show the total picture. That's why most team meetings last longer than necessary, as much of the time is consumed determining what the data is saying about a property's performance and what actions need to be taken over the next few weeks
This is why we created a new tool for our clients called the RentVision Report Card, which provides a clear and understandable snapshot of your apartments' successes. It's designed to restore focus to your meetings and eliminate the time it takes to go over each property individually.
In this video blog, Lucas, a RentVision Strategic Advisor, explains how the Report Card works and why it may become the only tool your team will want to use in meetings going forward.
Why We Built the RentVision Report Card
The story behind why the RentVision Report Card was built ties back to a recurring obstacle during meetings with clients.
"We would tell them things like how many website visits they had, how many walkthrough video tours their community gave in a given month, or how many phone calls that they had," Lucas said. "The problem with those numbers is that they weren't very helpful. It would be hard for a client to know if that's good, if that's bad, if that's above average, or below average."
To know those things, we realized that our clients needed to see how their numbers stacked up against similar properties. It's easy to collect all the data for your properties, but difficult to understand what the data is trying to tell you unless you know how your numbers compare to others. That is the needed clarity that's possibly lacking from your multifamily team meetings.
"We looked at all the communities we worked with and divided them up by different property classes," Lucas said. "We started figuring out the average amount of website visits, or the average amount of phone calls, in each given month for each different property class so that we can compare apples to apples."
That's also why we built this data summary as a report card—it's a concept we can all understand. We apply letter grades and color indicators to each of your data points so you can easily assess your performance.
"We quickly realized that if you're doing the same as your peers, you're doing good. Things are going well and there's not a problem. So, we actually start with a 'B+'. If you're doing that average...that's a 'B+'," Lucas said. "Now, when things are above average that's when we move into the 'A' category. When things are significantly below the average, we start moving into the 'C' and then the 'D' area to help create an indicator that there's a big discrepancy in how your community's performing versus your peers."
What's In The RentVision Report Card
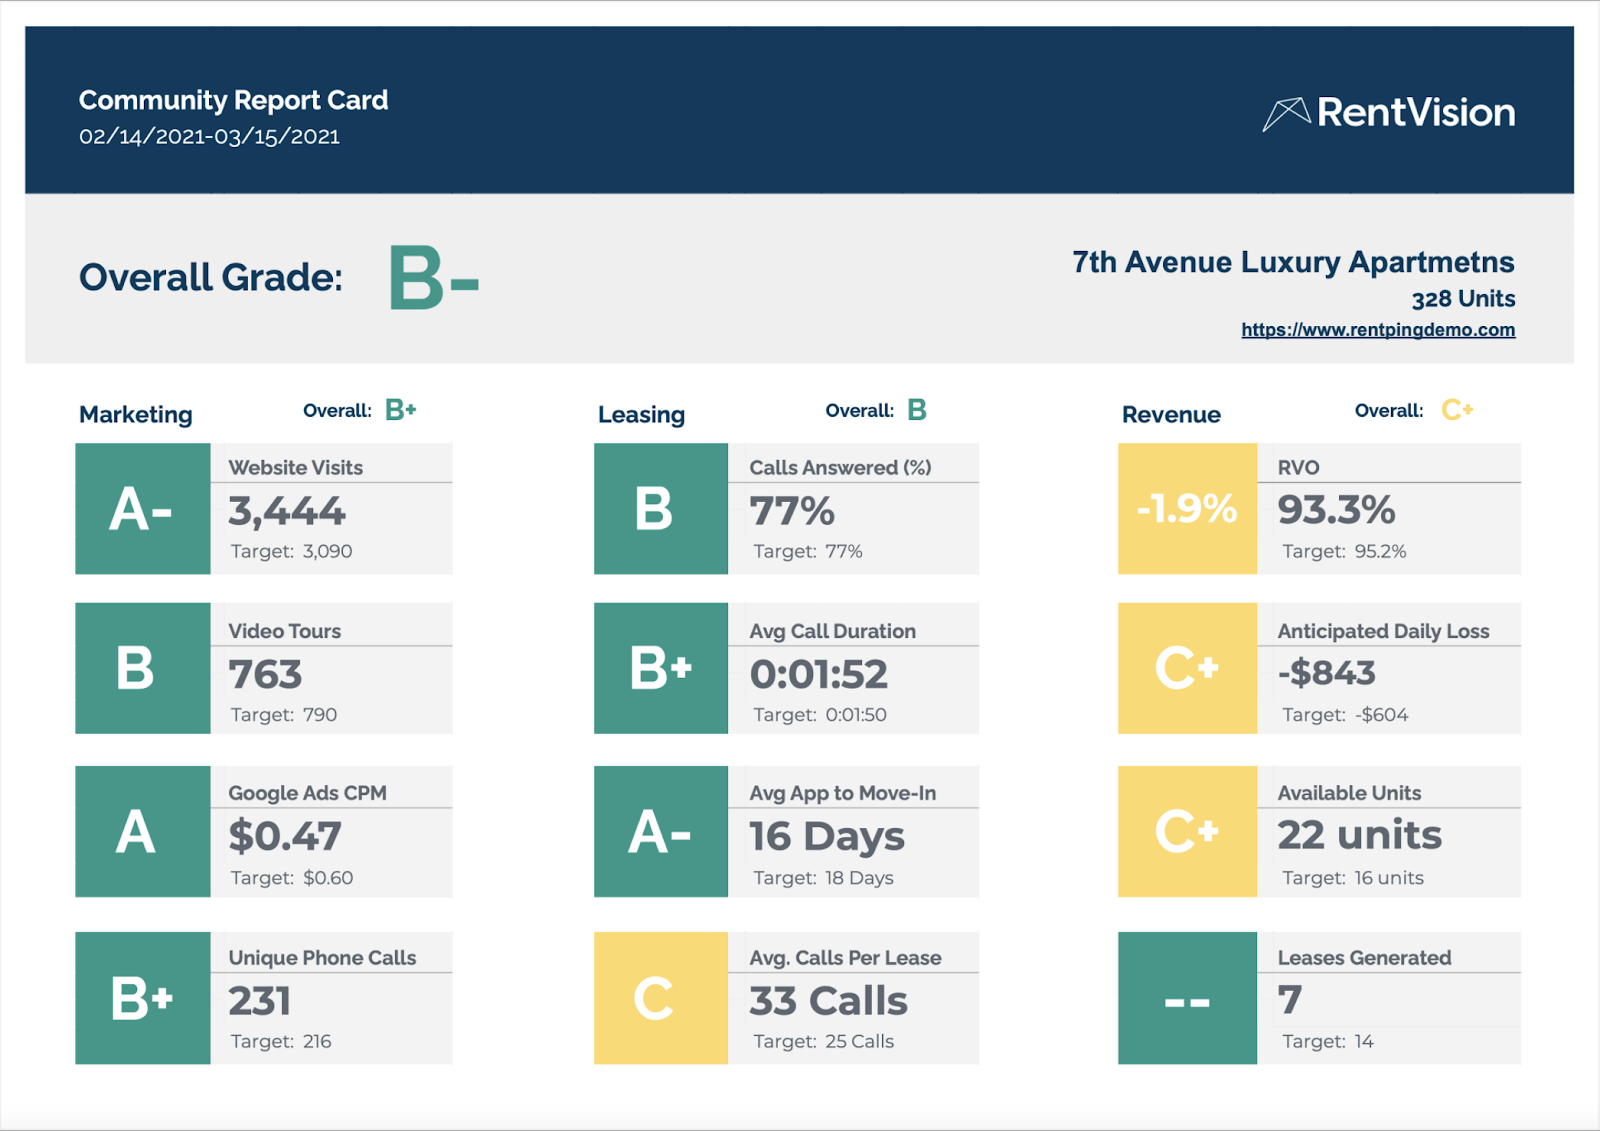
Example of the RentVision Report Card.
The three main categories evaluated in the RentVision Report Card are Marketing, Leasing, and Revenue. Each category is given an overall grade, as well as its associated metrics, based off of targets representing how similar properties are performing.
The metrics measured in the Marketing category include:
- Total number of website visits
- Video tour views
- Cost Per Minute of your Google Ads
- Unique phone calls
"We're trying to identify the key pieces, or key stream, of how somebody begins to engage (with your apartment community) and then converts to a lease," Lucas said.
It's important to start with how many prospective residents are coming to your website, and once there, how many take a virtual tour and see inside your floorplans.
To measure this engagement, we created a helpful metric to determine the effectiveness of your Google Ads called Cost Per Minute. It looks at how much it costs to drive traffic to your website, and how many minutes those visitors spend on it. The lower your Cost Per Minute, the better your ads perform because it indicates they're generating more qualified traffic.
"(Cost Per Minute) is helping us know if the traffic that we're driving to the website is being done in an efficient way," Lucas said. "We're making sure that the people who are coming to the website are engaging and staying on it for a really long time."
The final metric of unique phone calls is also critical, as we're looking to see how many of those engaged web visitors reach out to your leasing office.
The Leasing category looks at:
- Percentage of calls answered
- Average call duration
- Average amount of days a unit is vacant between when an application is received and the move-in date
- Average amount of calls per lease
"What we're trying to do here is help you see how the on-site teams are handling the phone calls and those conversations, and what that looks like from a conversion standpoint," Lucas said.
These metrics are especially valuable for monitoring your team's performance. Your marketing plan could be functioning at a really strong level—driving the right prospective residents to your website—but your leasing staff may or may not be operating as well as they could. Both sides need to be working in order to generate more leases.
Finally, the Revenue category features:
- Your Future Occupancy Projection (RVO in the image above)
- Anticipated daily lost rent
- Available units
- Leases generated in previous month
The Revenue category is the most important of the three because it has the most influence on your team's decision making process.
Future Occupancy Projection is a predictive metric we designed that gives you the ability to know what your occupancy is going to look like in the next few weeks. We compare this number with another metric we designed called Future Occupancy Target, which is your future occupancy goal.
"By having those two numbers, we know whether or not they're going to be at the occupancy they want to be at for this time of year," Lucas said. "And it helps us know whether or not we need to help them drive more traffic or less traffic if they're going to be really full."
The other important metric in this category is the anticipated daily lost rent. This essentially provides a dollar figure to show you how much it's costing you when you've got too much vacancy for that specific time of year.
How The RentVision Report Card Gives Your Team Direction
It's difficult to diagnose, let alone solve, the problems within your various properties, which is usually why your meetings get too long. With the Report Card, not only are you provided with a clear picture of what may be a problem in your community, you're also getting a roadmap for how to solve it. That is key. Your team will feel more confident about achieving your marketing, occupancy, and revenue goals when it knows exactly what needs to be done.
For example, here's something you could see as we review your Report Card with you:
- In the Revenue category, your Future Occupancy Projection is falling short of your Future Occupancy Target. This indicates that there's going to be a vacancy issue coming in the next few weeks.
- In the Marketing category, the website visits are below average, thus making the number of video tours viewed or phone calls also lower.
So, what is the problem, and how would we solve it?
In this scenario, the solution is rather simple. Your community needs traffic driven to its website so that more people can view your walkthrough video tours and reach out to your leasing staff.
"To help solve the vacancy issue before it becomes a vacancy issue, the recommendation could be something like driving more traffic through Google Ads or Facebook Ads, turning on additional (ad) campaigns, or increasing the (ad) budget," Lucas said.
While the Report Card gives your team the capability of easily assessing property performance, it's worth noting that you won't truly get the most out of it without the help of one of RentVision's Strategic Advisors. Without their assistance, you may misdiagnose problems, like increasing your ad budget when your occupancy is high because your website visits graded slightly below average, or scolding your team for their shorter call duration when that's a typical occurrence for leasing staff working at a property with high occupancy.
"(The metrics) are more like indicators on a dash, because there could be a low number but that doesn't necessarily mean it's going to be a problem," Lucas said.
How To Begin Using The RentVision Report Card For Your Team
If you're already a client of ours, contact your Marketing Advisor to learn how you can begin using the RentVision Report Card and improve both your team's meeting cadence and overall management strategy.
If you're here because you need a better way to evaluate your properties, or are interested in learning more about how RentVision can make renting your apartments easy, please fill out the form below. We'll schedule a time to meet so we can learn more about you, your properties, and your goals.