
If your apartment community's target occupancy was 95%, how would you feel if your occupancy was at 93% the week before Thanksgiving? Transversely, how would you feel if your occupancy was at 93% at the beginning of May?
Most property management companies would feel much better about their occupancy being slightly below target in May rather than the week before Thanksgiving. That's because the latter takes place at historically one of the slowest times of year for leasing activity, while the other date occurs at a moment when demand usually begins to peak. If your occupancy was struggling at the onset of a difficult season, like around Thanksgiving, then a couple of lease expirations could send your apartments into a tailspin that would require a significant sacrifice from either your marketing budget or rental rates to overcome.
There is a way to prevent this, and that is by knowing your seasonality. Being able to identify both your busy and slow leasing seasons can make a monumental difference for your team and your apartment community because you can apply that knowledge to your leasing and renewals strategies and ensure more leases expire during your seasons of high demand.
In this blog, we'll explain how to discover and interpret your seasonality data so that you can choose which months of the year you'd want more leases to expire.
Video: How To Predict Apartment Seasonality
How To Discover Your Apartment Community's Seasonality
You can discover your apartment community's seasonality by measuring traffic data to the website. Why web traffic? It turns out to be an extremely accurate assessment of seasonality.
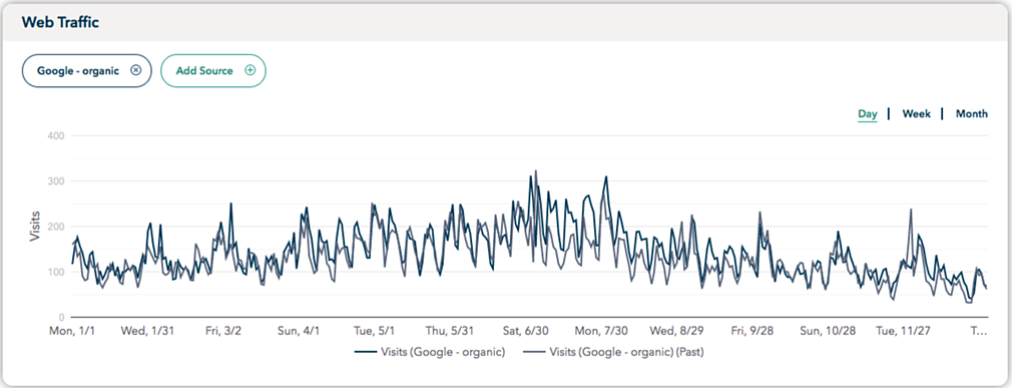
Organic web traffic data from an apartment community in Lincoln, Nebraska
that partners with RentVision.
The gray line in the illustration above is a measurement of all the organic web traffic this apartment community received in 2017. The navy line represents 2018. Notice how consistent the two patterns are. This means we can pinpoint exactly when demand will spike or flatten every year for individual apartment communities.
Essentially, high amounts of website traffic are indicative of seasons of high demand, while less traffic is common during slower seasons. This is crucial because when you're in a busy season, you'll also be experiencing more turnover and have more vacant units available. Yet you can feel comfortable about where you stand in times like that because you also have the amount of web traffic and leads being generated to account for it. Inversely, when you're in a slower season and have less traffic coming in, you'd be nervous if you have more vacant units available then expected. This is why being able to identify exactly when those changes occur with your demand is critical for every apartment community.
Hopefully, you have Google Analytics set up on your apartment community's website as that is where we'll go to get this web traffic data. (If not, here's a quick guide on how to add Google Analytics to your site.)
The best way to see your seasonality is by reviewing the last 12 months of organic traffic to the website. Organic traffic is especially key because it's counting the number of people who searched directly for your apartments online, which represent your best qualified leads.
Once you've logged into your Google Analytics account, do these four steps to see your seasonality:
- On the left side of the screen, click "Audience" and then click "Overview".
- Near the upper right corner, change the data range to the past 12-month time period.
- A little below that, be sure the data shows monthly data by selecting the 'Month' button.
- On the left side of the page, if "All Users" is selected, unselect that box and check "Organic Traffic" instead.
Once you've completed these four things, this is what you should see on your screen:
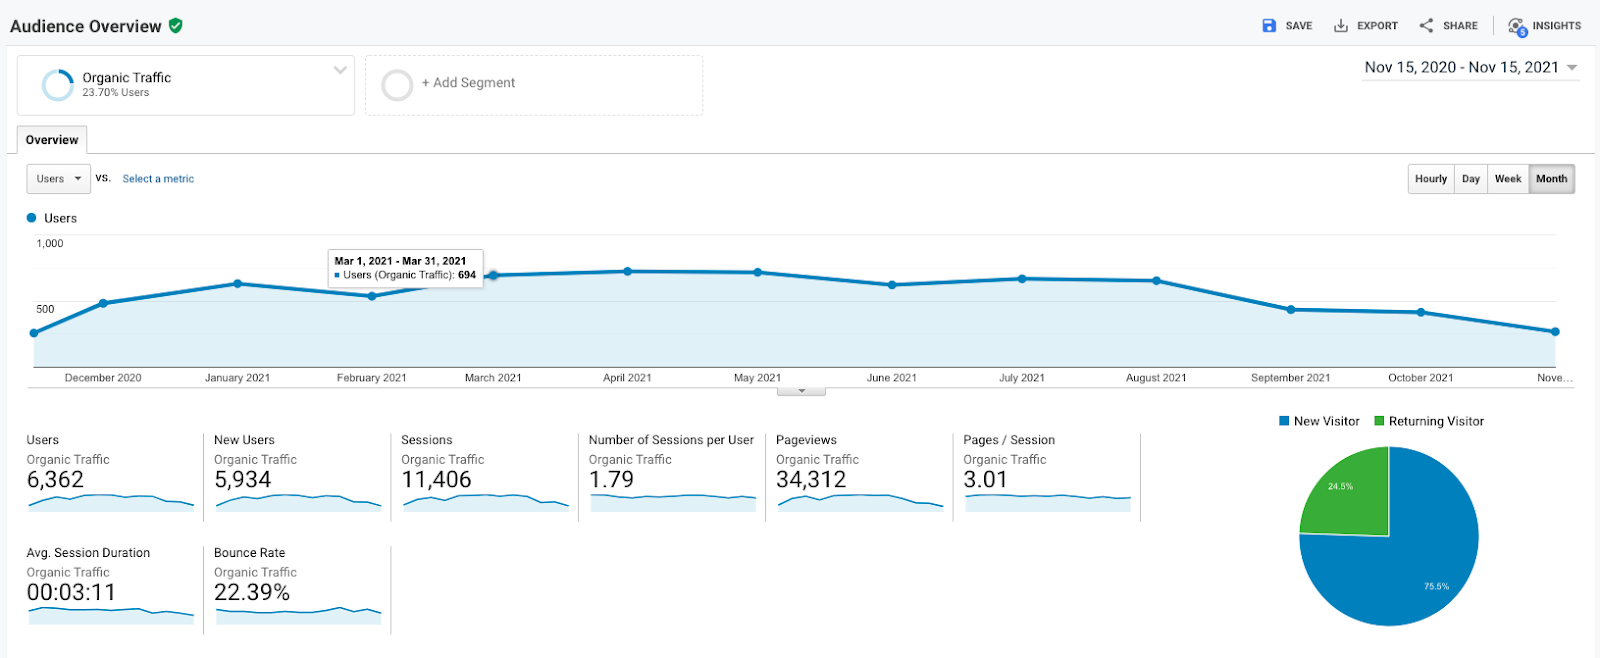
Google Analytics data for an apartment community's website.
How To Interpret And Utilize Your Apartment Community's Seasonality Data
The image above displays what we've called the 'seasonality curve', which represents the fluctuation that occurs in demand throughout the year at apartment communities. For the one featured, demand peaks in April and remains consistent throughout the summer months before dwindling off in September.
Something interesting we've observed in studying seasonality for years is that it's unique for every apartment community. Even within the same metro region, one apartment community will experience a different seasonality compared to another a few blocks away. There are numerous factors—proximity to schools or businesses, asset classes, rental rates, etc.—that cause this to happen. This is yet another reason why determining your own community's seasonality is recommended.
Once you have that data, the next step is being able to accurately interpret it so that you can begin to map out when you would want more of your leases expiring.
The table below is an illustration of one method we'd suggest to help you interpret your own data. By charting out the actual organic traffic count for each month, and then calculating each month's percentage of annual traffic, you can begin to easily identify the months where you'd like to have more leases expiring than others.
| Month | Organic Traffic Count | Percentage of Annual Traffic |
| January | 633 | 8.91% |
| February | 634 | 8.92% |
| March | 847 | 11.92% |
| April | 726 | 10.22% |
| May | 652 | 9.18% |
| June | 563 | 7.92% |
| July | 628 | 8.84% |
| August | 530 | 7.46% |
| September | 443 | 6.24% |
| October | 522 | 7.35% |
| November | 477 | 6.71% |
| December | 450 | 6.33% |
| Totals | 7,105 | 100% |
To calculate each month's percentage of annual traffic, simply take that month's traffic count and divide it by the total traffic count for the year. Then take that number and multiply it times 100.
(Monthly Organic Traffic Count / Total Organic Traffic Count) x 100 =
Percentage of Annual Traffic
(633 / 7,105) x 100 = 8.91%
On the simplest level, you can see that the data above suggests this example apartment community to aim to have more leases expiring during the months of March, April, and May, as that is the time period where it's in highest demand as confirmed by web traffic counts.
So let's go back to the question proposed in the introduction. How would this community feel if it's occupancy was 93% the week before Thanksgiving? What about the beginning of May? The data clearly confirms the answer. It would feel great in May because it's right in the midst of the busy season. Thanksgiving, however, would be a disastrous moment.
This information, then, should dictate how the apartment community handles lease expirations and, more specifically, lease renewals.
Say a lease came up for renewal in March. One, if the tenant decides to not renew, that is perfectly fine for that apartment community because it expects to have more turnover during its busy season and is confident it has the demand to quickly occupy it. However, it'd still want to be smart with the terms they offer in that lease renewal should the tenant seek to extend their stay. They could offer another 12 months, because they know that the lease would expire at a great time, but it would be disadvantageous to offer 3 or 6 month terms when that means the lease would expire at a less than ideal time. Should that be what works best for the tenant, it's reasonable to increase their rental rates as a premium because they're essentially buying time.
Now say a lease renewal came up in December, the worst month for that apartment community. It would be advantageous for it not to offer a 12 month lease term in the renewal as that's only extending a potential vacancy problem a year into the future. Instead, it would be smarter to only offer 3 or 6 month lease terms so that the lease expires at the right time.
This methodology is featured more within our whitepaper Renewals Strategies For Apartment Communities. Download and complete the form below for your free copy today.