
This is the second part of a blog series written by RentVision Founder & CEO, David Watson, about gaining control over future vacancy. You can read Part I, "How To Predict Future Vacancy", here.
In my last blog post, we discussed how apartment communities react to vacancy crises rather than predict them. I explained how Future Occupancy Projection, our predictive occupancy metric, can help communities determine in advance when changes in occupancy will occur, allowing them to make educated marketing or pricing decisions and gain control over their future vacancy.
Knowing your future occupancy is helpful, but how do you know whether or not it's actually going to become a problem worth addressing? The answer comes in how your Future Occupancy compares against another metric that takes into account your community's unique seasonality. That's why we've created another metric called Future Occupancy Target, which is what we'll focus on in this blog.
Everyone in our industry knows that demand can fluctuate throughout the year. In most markets, prospective residents choose to move during the summer rather than the winter, and there's also been a historical decrease in traffic around the start of the school year.
It's unfortunate that most apartment communities have an Annual Target Occupancy (Annual TO) goal that doesn't account for the turnover they know will occur at different times throughout the year. If demand fluctuates, the target occupancy should also fluctuate over time, too. Understanding your community's seasonality is the first step towards setting an ideal and realistic target.
Knowing Your Seasonality Matters
A common line we've heard in conversations with multifamily executives over the years is, "We would like to be 95% occupied." While that is a great goal to strive for, many of their staff members misinterpret that directive as having to target a 95% occupancy rate year-round. Suddenly, a culture is built on doing anything and everything to meet or exceed that number because anything below is unacceptable.
Those types of situations can be avoided if those same executives who want to be at 95% occupancy simply rearrange their goals. Those same executives who want to be at 95% occupancy should rearrange their goal. A better directive—one that's both realistic and maximizes revenue—is averaging 95% occupancy over a 12-month period of time. After all, if there is more demand in the summertime, it would make sense to have more turnover and therefore, more vacancy.
How to Determine Your Unique Seasonality Utilizing Marketing Data
The quickest and easiest way to get a concise view of your community's seasonality is through Google Analytics. Fundamentally, higher website traffic means you have more demand, therefore, you should also have more turnover and more vacant units. Lower traffic means you have lower demand, thus resulting in less turnover and less vacant units.
Here's a quick guide on how to add Google Analytics to your marketing arsenal (if you haven't done so already). It's important to note that we're only looking at organic traffic. If you use pay-per-click advertising campaigns in Google, you can dynamically regulate the amount of traffic you're receiving online. Organic traffic comes from people searching directly for your apartment community on Google, which are the type of visitors we're looking for because they're the furthest along in the apartment hunting process and represent your most qualified leads.
The best way to assess your seasonality is to review 12 months worth of organic traffic data. To view this data:
- Log in to your Google Analytics account.
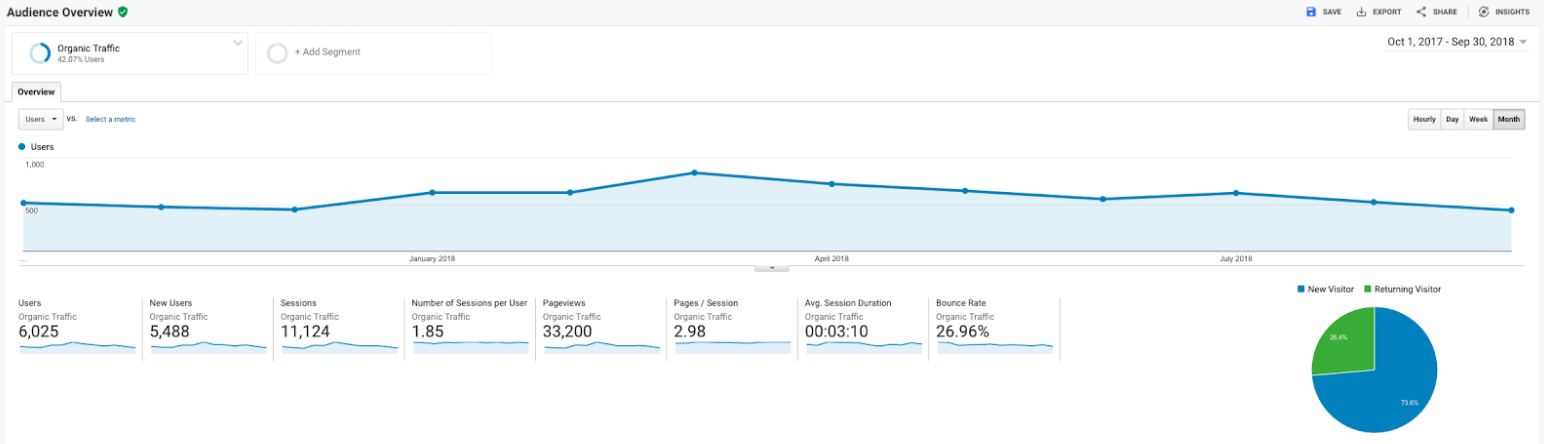
- On the left side of the screen, click "Audience" and then "Overview".
- Near the upper right corner of the page, change the data range to a 12 month time period by selecting the "Month" button.
- If "All Users" is selected, unselect the box and check "Organic Traffic" instead.
You should be able to see a chart like this once you've completed those steps:
To help explain the data in the chart, here's a table that breaks down the actual organic traffic by month, starting in January. (Note: green numbers show the 4 highest trafficked months, black shows the middle, and red are the lowest trafficked months.)
|
Month |
Organic Traffic Count |
Percentage of Annual Traffic |
|
January |
633 |
8.91% |
|
February |
634 |
8.92% |
|
March |
847 |
11.92% |
|
April |
726 |
10.22% |
|
May |
652 |
9.18% |
|
June |
563 |
7.92% |
|
July |
628 |
8.84% |
|
August |
530 |
7.46% |
|
September |
443 |
6.24% |
|
October |
522 |
7.35% |
|
November |
477 |
6.71% |
|
December |
450 |
6.33% |
|
Totals |
7,105 |
100% |
As it so happens, these numbers come from an actual property in our hometown of Lincoln, Nebraska. It had strong traffic beginning in January, with large spikes during the spring months of March, April, and May. The traffic stays fairly strong throughout the summer period before tapering off towards the end of the year.
Whatever impacts the seasonality of this particular property doesn’t necessarily have the same effect on even the community next door. We have studied demand on hundreds of properties of all classes, and have concluded that seasonality is unique to each property—not just a metro area.
Just take a look at the difference between these two seasonality curves:
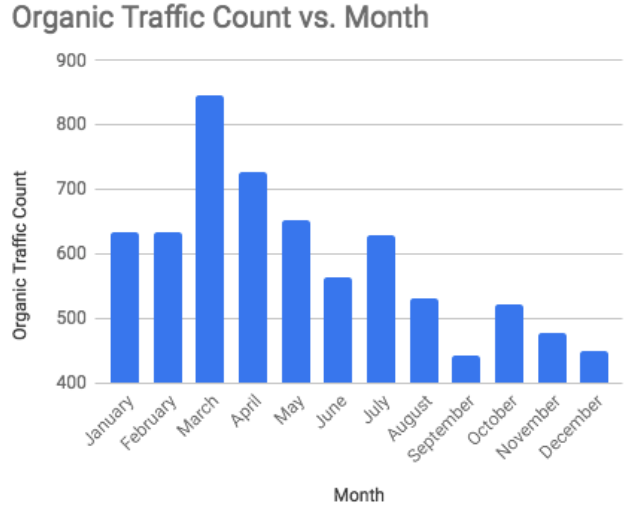
One Property in Lincoln |
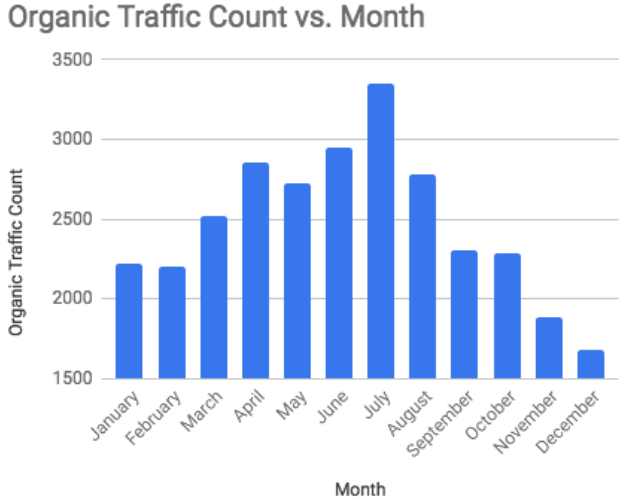
Multiple Properties in Lincoln |
This data puts into perspective how challenging and unrealistic it would be to maintain an even 95% occupancy at all times. An apartment community would have to generate 8.33% of its annual traffic each month in order to have the same demand every month. Because demand fluctuates, it makes sense that your turnover will change and ideal turnover should go up and down throughout the year.
These numbers illustrate why your unique seasonality should be considered when setting your current Future Occupancy Target.
How Future Occupancy Target Works
The Future Occupancy Target algorithm we've created is fairly complex. The simplest explanation for how it works is that it projects your community's web demand for the next couple of weeks by reading your seasonality data, and then adjusts on a daily basis. Over time, your Future Target should average the Annual TO goal you've established.
Web traffic has proven to be an extremely accurate measurement of your apartment community's seasonality. Take a look at the illustration below:
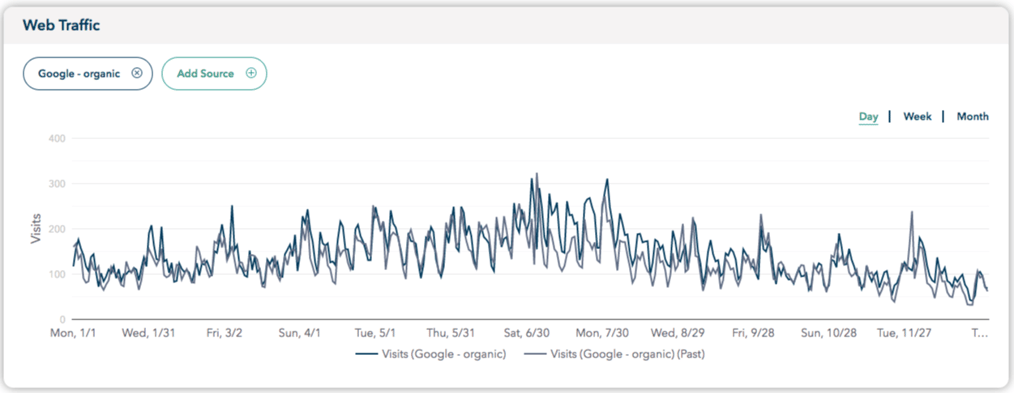
This chart outlines the organic traffic that an apartment community in Lincoln received in 2017 (gray) and 2018 (blue). It's remarkable to see how consistent the seasonality curve stayed between both years.
Future Occupancy Target is dynamic in that it accounts for the changes in demand that your apartment community experiences in order to establish a realistic occupancy goal for that day.
The community in the example above set their Annual TO at 95%. Their Future Occupancy Target was around 96% for the early part of the year likely due to it being this community's slower winter period. When entering the spring months, the Future Target dropped to 94.4%, taking into account the increase in web traffic that is occurring.
If your Future Occupancy Projection is well below your Future Occupancy Target, that's when you know that you're going to have a vacancy crisis coming. This is how we diagnose problems.
For the record, we observed a dramatic change that began around the second week of March 2020. This is about the time when the Coronavirus pandemic began to affect us in Lincoln, Nebraska, and this community saw their Future Target shoot up to 96% because nobody wanted to move apartments while under lockdown restrictions and uncertain times. Normally, we would see their Future Target continue to decrease below 94% heading into the summer. This goes to show just how intuitive and informative our Future Occupancy Target algorithm is.
How to Set Your Own Future Occupancy Target
(If you're interested in adding RentVision's predictive occupancy metrics to your analytics data, this would be a good time to scroll down towards the conclusion and fill out the contact form below! Otherwise, this next section features some of the math to help you set an imprecise Future Occupancy Target number for yourself.)
To begin setting your own Future Occupancy Target, you first have to establish your community's Annual Target Occupancy (Annual TO).
By this point, I hope it's clear that, even in the most ideal circumstances, it's almost impossible to achieve an Annual TO of 97% or higher. A reasonable one should be at about 94-96% in a good market. However, if you're in a slower market, that number should be lower.
Once your team decides on that Annual TO number, you can then use the directions from earlier to examine your community's seasonality from the last 12-month period. Remember, in order to maintain a steady 95% occupancy, each month's web traffic has to average 8.33%.
So, for months that have a higher traffic average than 8.33%, you're going to want to establish a lower target occupancy. For every percentage point that is higher than that mark, subtract half of a percentage point from your Annual TO number of 95%. For example, if in June your average traffic was at 11.5%, then that month's target should be 93.5%. When you have more demand you can have more turnover and more vacancy.
You can reverse that same rough method to alter the target during month's when the average web traffic is lower than 8.33%. For every point lower than that, add half of a percentage point to your Annual TO. When demand is going to be slower, you want to have less turnover and less vacancy.
While the math doesn't provide you with a precise, daily number as our Future Occupancy Target metric does, it can still be helpful when assessing your future occupancy.
Conclusion
Now you should have two metrics at your disposal:
Future Occupancy Projection
Future Occupancy Target
These two sets of data can be used to determine exactly where your apartment community's occupancy stands at any given moment of time. If your Future Occupancy Projection is equal to or greater than your Future Occupancy Target, you know you are in good shape over the next few weeks. If your Future Occupancy is below your Future Target, you know you are going to have an upcoming vacancy problem. My next two blogs will prepare you for fixing it.