We designed RentVision Revenue Management to simplify onsite operations, improve leasing, and eliminate the frustration of setting prices for every unit.
It's so smooth that there's little users need to do within the software because it automatically sets prices for new leases and renewals according to your communities' needs while also giving you tools and analytics that allow everyone to trust the price.
But knowing that your communities' rent prices and revenue are important, we've put together this guide to provide more detailed information about how RentVision Revenue Management works so that you and your teams get the most out of their experience. This guide will cover:
- How RentVision Revenue Management sets prices.
- How to access pricing information for each unit in the RentVision Platform.
- The renewal features available with RentVision Revenue Management.
- An overview of the revenue analytics available in the RentVision Platform.
Let's get started!
How RentVision Revenue Management Sets Prices
RentVision Revenue Management (RVRM) utilizes your communities' unique, leading supply and demand indicators to set optimal prices for every unit.
It predicts upcoming demand using your community's website traffic data. The software then compares that to your supply, which is your current unrented vacancy, plus the timing of your upcoming move-outs and ready dates as reported within your property management software.
This enables RVRM to adjust rent prices in advance of fluctuations in demand more accurately and in tune with what your communities need.
It then further optimizes the price at the unit-specific level by factoring in unit amenities and applying automated discounts to address underperforming floorplans or units that have sat vacant for too long.
Lastly, prices are adjusted by the length of the lease term.
How to Access Pricing Information in the RentVision Platform
There are multiple ways to see unit pricing information inside the RentVision Platform.
Availability Page
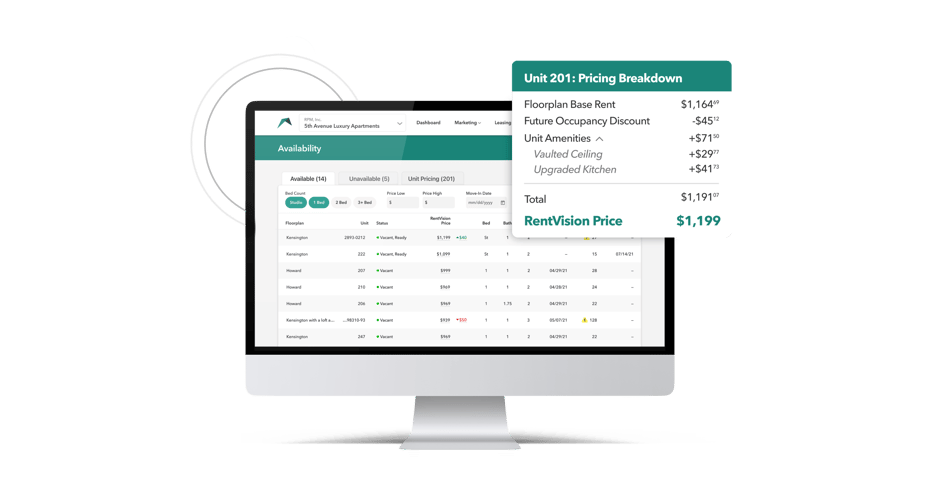
The Availability page gives you a comprehensive glance at the status and price of every unit in your community, and it's accessible from the Leasing tab in the RentVision Platform. The data shown on the page is updated three times per day, meaning it always displays the most accurate information you need to assess the state of your property.

You can toggle between the Available, Unavailable, and Unit Pricing (all units) tables on the Availability page. You can also filter units by bed count, low or high rent, and move-in date.
Clicking on any row opens a sidebar with more detailed pricing information about that specific unit, including the Rent Pricing Breakdown (more on that below), which shows exactly how each unit's price is calculated.
The data displayed in the table differs depending on which tab you are viewing:
| Available | Unavailable | Unit Pricing |
|
|
|
The value to the right of the "RentVision Market Rent" column shows the most recent adjustments to that unit's pricing.
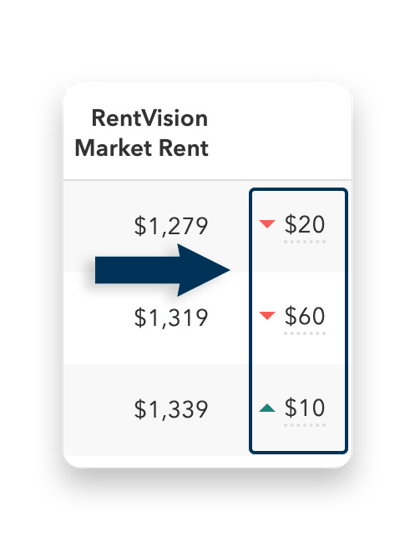
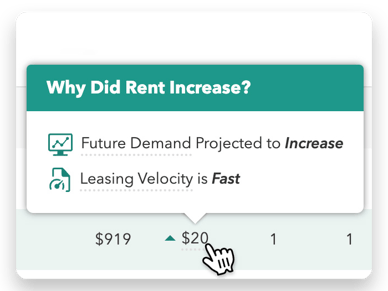
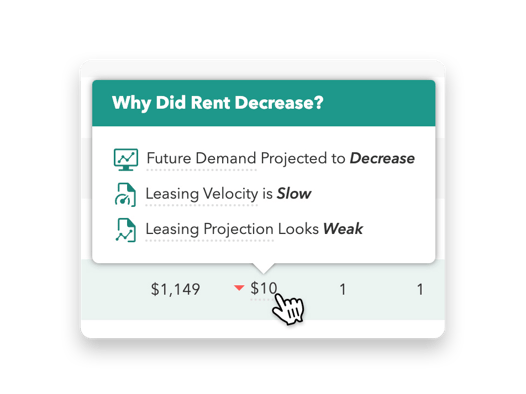
You can hover over that number to see an explanation for why the price increased or decreased.
|
|
|
|
There are five reasons why rent can increase or decrease… |
|
|
|
The Availability page will become your daily go-to for seeing every critical piece of information about the status and price of every unit.
The Rent Pricing Breakdown
The Rent Pricing Breakdown shows how a unit's market rent is calculated, including base rent, any discounts, and unit amenity adjustments. The breakdown appears in a sidebar after clicking on a unit number on the Availability page.
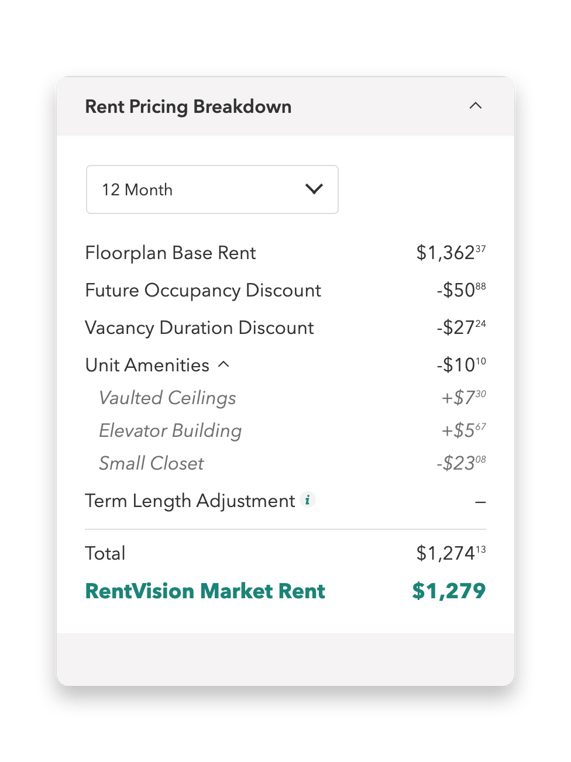
The breakdown also includes any pricing adjustments based on the selected term length (if the term length differs from the standard 12-month lease).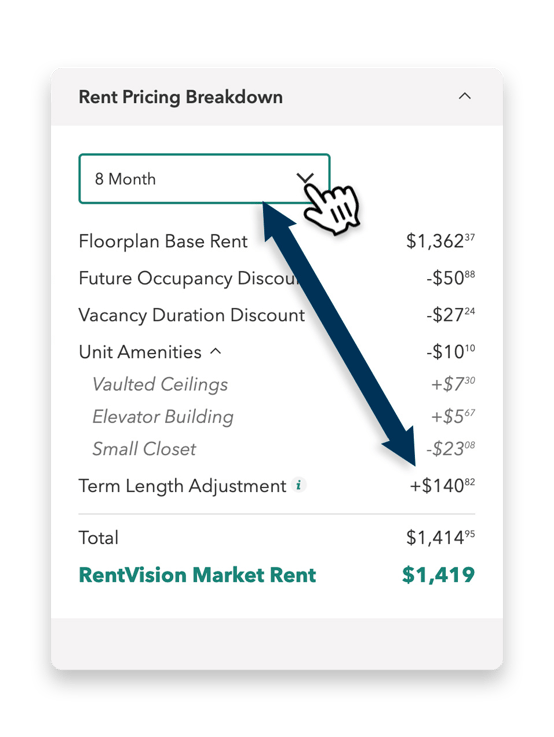
The types of automated discounts shown in the Rent Pricing Breakdown are the Future Occupancy Discount (like the example above) or Vacancy Duration Discount. Some units may have both discounts applied if warranted.
The other notable feature of the Rent Pricing Breakdown is the inclusion of unit amenities. Unit amenities are unique features within each unit that can positively or negatively impact a potential tenant's living experience. Upcharging for positive unit amenities, like vaulted ceilings or upgraded kitchen appliances, while simultaneously discounting negative unit amenities, like a small closet or view of the dumpster, is a best practice for maximizing revenue and building price transparency.
Finally, the total price will be rounded up to the nearest $9, to determine the RentVision Market Rent price. This is to maximize revenue while avoiding the pricing resistance that occurs at the $10 mark. The only time this rounding is different is when rounding up would create a price that ends with $109, $209, $309, etc. In these cases, the price will be rounded down to the nearest nine (ex. $99, $199, $299, etc.) since every hundred dollars is where the most significant price resistance exists.
With the Rent Pricing Breakdown, you'll never wonder again how your communities' rent prices are set, and most importantly, you're providing current and future renters with the most straightforward depiction of a unit's price.
Above the breakdown in the sidebar, you can find the Rents By Term table, which displays market rent adjusted for every term length—everything in one easy-to-read table. (Note: You can customize the terms displayed to match your community's policies.)
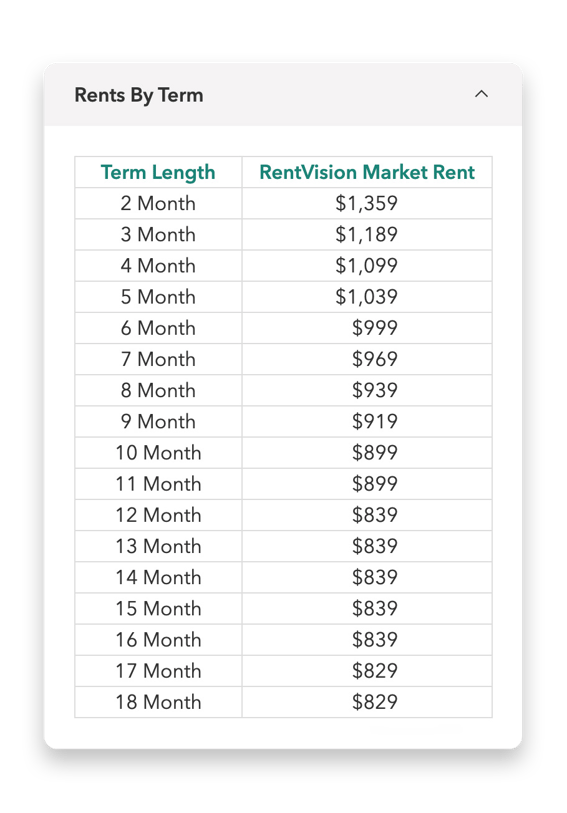
The Rents By Term table will help in potential leasing conversations as you work to find the best logical lease term fitting a prospect's needs.
Renewals Features Available with RentVision Revenue Management
RentVision Revenue Management doesn't just automate pricing; it includes powerful tools for improving the renewal offer process and allowing you to automatically get suggested lease terms. You get access to the "Renewals" page, where you can find all pertinent information on upcoming renewals.
RentVision Revenue Management also includes a renewal letter template creator and letter generator, so you can quickly create renewal offers with specified terms or suggested terms for all selected units.
Let's review the features in RentVision Revenue Management that'll automate the pricing and simplify the delivery of your lease renewal offers.
The Renewals Page
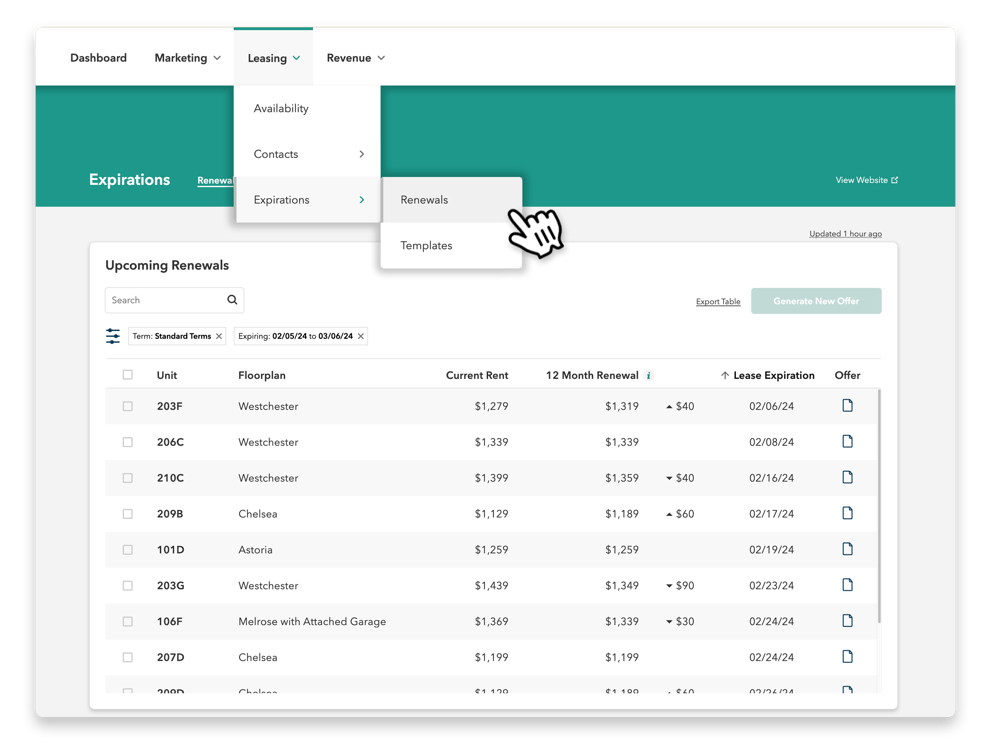
In the RentVision Platform, under the leasing tab in the main menu, hover over Expirations. There, you'll click to open the Renewals page, where you'll initiate the process for every future renewal (path: Leasing > Expirations > Renewals).
The Renewals page features the Upcoming Renewals table, which shows you every lease set to expire in the next 60-90 days (this range is shown by default; you can customize it to your community's notice requirements), including the unit number, floorplan configuration, the tenant's current rent, the new 12-month renewal rent and its difference from the current rent, the lease expiration date, and if there's currently a renewal offer for that unit. You can filter the table to show upcoming lease renewals by different term lengths, expiration date windows, renewal offer status, and configuration, or use the search function to find a specific unit. (Note: the search function does not override any additional filters applied. If the unit isn't appearing after searching, try clearing any existing filters.)
The Renewal Pricing Breakdown

Clicking on any row in the Upcoming Renewals table will open a sidebar on the Renewals page that features more detailed information about that expiring unit, including the Renewal Pricing Breakdown. Much like what we do in the Rent Pricing Breakdown for new leases, the Renewal Pricing Breakdown details how the price for each renewal is set.
A unit's renewal price is calculated using a matching set of factors as new lease prices, with a bit of change in how discounts are applied. If the market rent has increased from a tenant's current rent at the time of renewal, the renewal price may apply a market rent discount. For clarity, you can see the comparison between a tenant's current rent, market rent, and the renewal rent in the Renewal Rent Pricing Breakdown.
The sidebar also includes a "Renewals by Term" section that displays a table very similar to the one on the availability page. This table features a toggle to view the suggested term lengths and pricing, based on scheduled expirations. These suggested terms are designed to stack expirations so they are evenly distributed throughout the year. You can switch into "All Terms" view in order to see all terms, with non-suggested terms greyed out to indicate periods already high in expirations.

In the sidebar you can also see active renewal offers, and resident information.
Generating Renewal Offers
Producing renewal offers is typically time-consuming, requiring knowledge of Excel or mail merge features in Word to complete.
We eliminate all that frustration by making it easy for every RentVision Revenue Management user to generate renewal offer letters for specific units with automated prices for whichever term length you use with pre-created templates—all directly from the Renewals page.
|
How to Generate a Renewal Offer: |
You can either select specific lease terms to include in the renewal letter or select "Use Suggested Lease Terms" to include up to six lease terms specially chosen to distribute your leasing evenly. The 12-month term is always included. When using suggested lease terms and generating multiple letters, the selected terms will vary from letter to letter, as they'll be tailored for that specific unit and floorplan. If you would like to include month-to-month or limit the number of terms given when using suggested terms, reach out to your Client Success Manager to modify your letter generation settings.
If you're generating a single renewal letter, it will open immediately for PDF download (if it doesn't appear, try temporarily disabling your pop-up blocker). If you're generating multiple letters at once, they'll be sent to your email inbox. There's also a Renewal Offers section in the unit information sidebar of the Renewals page, where you can see additional details and download a copy of a renewal offer letter.
If the selected template includes an offer expiration date (which is optional), then you will be required to select that expiration date within the renewal offer pop-up before generating the letters. Offers that have passed their expiration date will show as expired both in the Expirations table's 'Offer' column and in the sidebar offers section.
You can also regenerate any previous renewal offer if necessary. As RVRM pricing updates once a week on your organization's preferred day, the current renewal pricing may have changed from what was previously offered, requiring an update. Or if you need a new letter with differing term options offered that maintain pricing as of the original offer, you can view any previously generated offer, adjust the terms selected, and regenerate the letter. Any expiration date set on the original letter will also be set on the regenerated letter.
You also have the option to download a CSV file of all units displayed in the Upcoming Renewals table by clicking the 'Export Table' button at the top right of the page. To change the units included in the CSV, change the filters for the table before generating. This allows you to apply that data to your existing mail merge or renewal letter process if that's what you prefer.
Building Renewal Offer Letter Templates
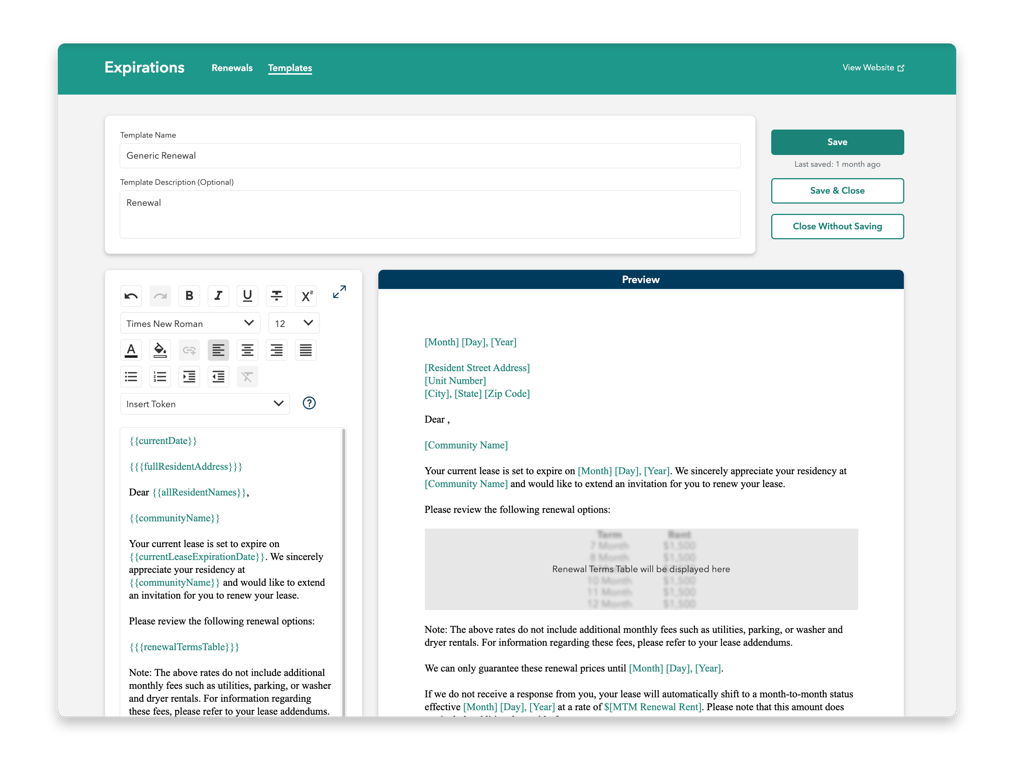
The Templates feature is only available to designated users within your organization. In it, you can create a new template or update an existing template for your renewal offer letters. We've even created a default letter for you to use that you can edit to fit your needs.
You'll see a list of your renewal offer letter templates on the Templates page. You can click on any of your current ones to edit or select the 'Create New' button at the top right of the page or duplicate an existing template to use as the starting point for a new template.
The renewal template content editor will appear alongside a preview that shows live updates as content changes to the renewal letter template are made. If you need to focus solely on the letter's content, you can expand the editor to fill the screen and close it again to see an updated preview.
Tokens
Much like what you would experience in a typical mail merge, we've applied dynamic tokens to use as you create or edit your letter renewal template.
Tokens allow you to insert placeholders for dynamic data in your letter templates. These tokens will automatically populate with your data, such as resident, unit, or community information, in your final letters. This data is pulled from your property management software.
If you need clarification on what all the tokens mean, click the question mark icon, and a sidebar will open with a glossary to learn more about what data corresponds to each available token.
When your edits are complete, just click save. Remember, when generating a renewal offer, you can choose which template you want to use.
With automated renewal pricing and an easy-to-use letter offer generator, your renewal process will become much more efficient.
Overview of the Revenue Analytics Available in the RentVision Platform
Lastly, let's go over the full suite of revenue analytics accessible by logging into your RentVision Platform account you'll want to get accustomed to for measuring the progress of your community's revenue performance.
The Floorplan Performance Table
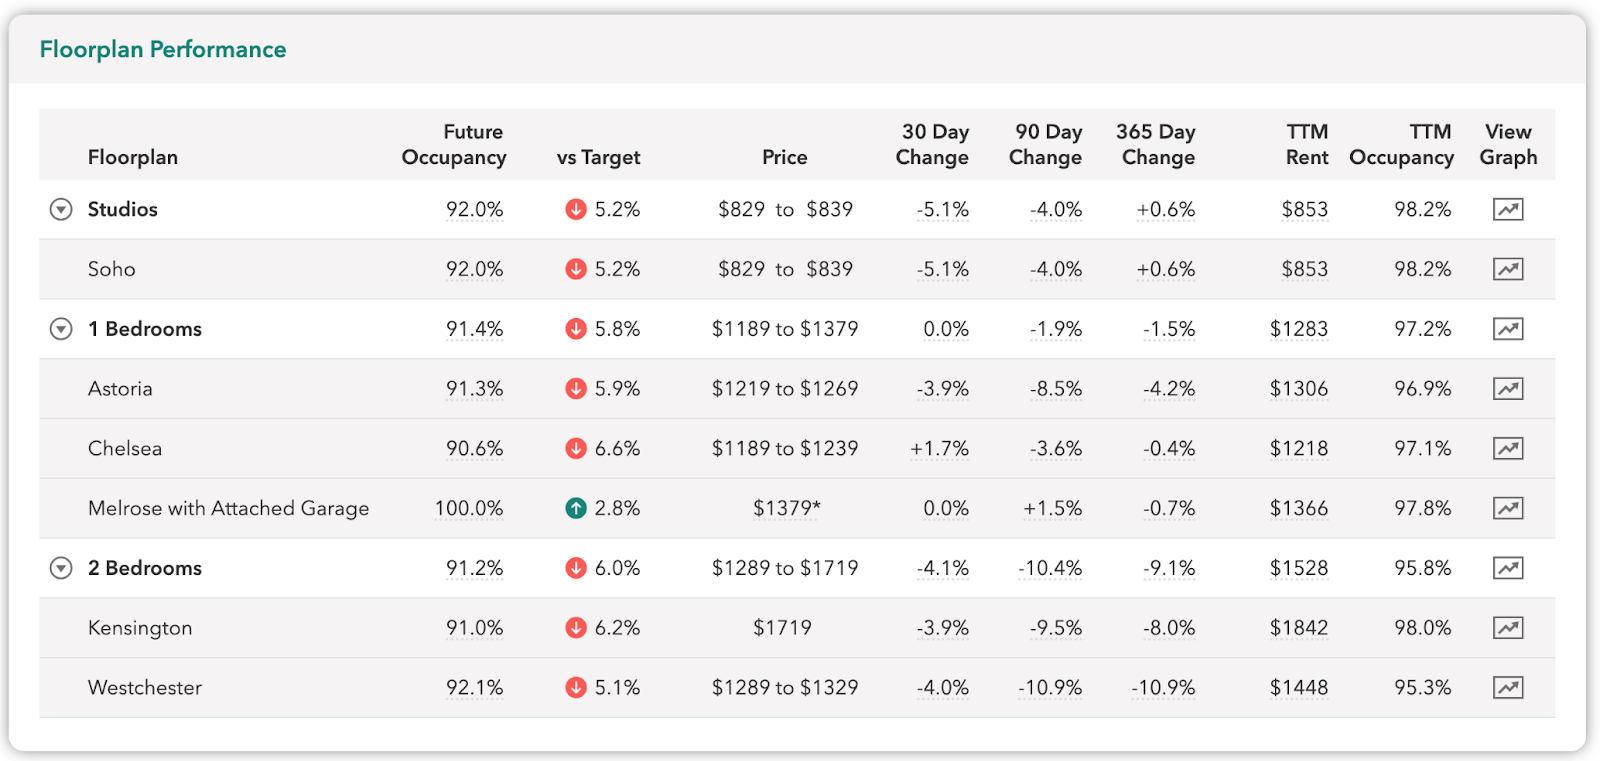
The Floorplan Performance Table is available on the Community Dashboard page upon logging in to your RentVision Platform account. It gives you a comprehensive glance at the performance of every floorplan on your property, including:
- Future Occupancy. This accounts for your upcoming move-ins and move-outs to project your floorplan's occupancy in the next few weeks. You can hover over the number to get a more detailed look into the number of units in that floorplan counted as occupied and those counted as vacant.
- Future Occupancy vs. Future Occupancy Target. Your Future Occupancy Target is a dynamic target adjusted for seasonality that uses your community's web traffic data to project upcoming demand. If your Future Occupancy is equal to or greater than your Future Occupancy Target, you know you are in good shape over the next few weeks. If your Future Occupancy is below your Future Occupancy Target, you know you will have an upcoming vacancy problem. We've made it simple for you to pinpoint potential vacancy issues in the Floorplan Performance Table.
- Price. This field shows the range of the lowest-priced and highest-priced units in a particular floorplan. Please note: this table only updates prices for available units. If no units are available, the price will have an “*” next to it, and you can scroll over it to see when the price was last updated.
- 30 Day Change. The average change in floorplan rent from the past 30 days. You can hover over the number to see the average floorplan price 30 days before the current day's date and the average changes between the lowest and highest-priced units in that floorplan.
- 90 Day Change. The average change in floorplan rent from the past 90 days. You can hover over the number to see the average floorplan price 90 days before the current day's date and the average changes between the lowest and highest-priced units in that floorplan.
- 365 Day Change. The average change in floorplan rent from the past 365 days. You can hover over the number to see the average floorplan price a year before the current day's date and the average changes between the lowest and highest-priced units in that floorplan.
- TTM Rent. The trailing 12-month rent price for that floorplan. Hovering over the number shows a comparison to the previous 12-month period.
- TTM Occupancy. The trailing 12-month occupancy for that floorplan.
The last column in the Floorplan Performance Table is labeled 'View Graph'. Clicking on the graph icon will open a tab in the table showing a graph like the image below:
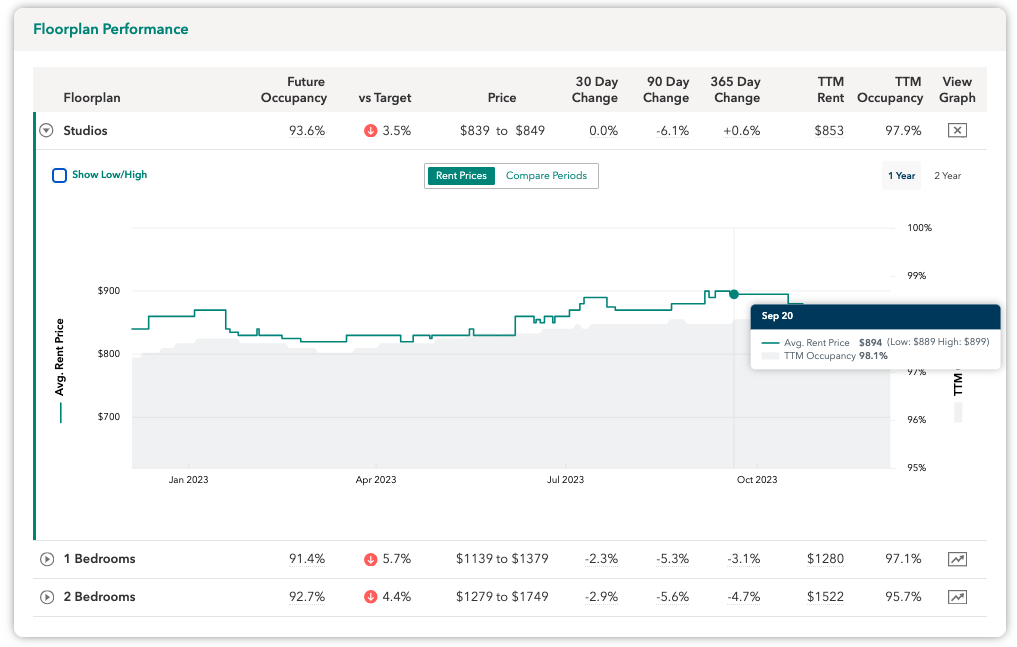
The graph compares a floorplan's Average Rent Price and TTM Occupancy. You can select the time frame of the data in the upper right corner and click the 'Show Low/High' option in the upper left corner. You can also select the 'Compare Periods' toggle and see the graph show the 3, 6, or 12-month charts alongside the same timeframe from the previous year. When hovering your cursor over the lines in the graph, a bubble will appear on your screen showing more precise numbers for each data point.
You can access the Floorplan Performance Table daily to diagnose any issues and follow along with the progress toward your revenue goals.
The Revenue Analytics Page

The Revenue Analytics page displays a pair of graphs—your Community Rent Revenue and Unrealized Floorplan Rent Revenue—and is accessible by clicking on 'Revenue' on the main menu of your RentVision Platform account, selecting 'Analytics,' and then 'Revenue.'
The Community Rent Revenue graph displays all incurred rent charges by month, whether paid or unpaid (the current month's data displayed will be month-to-date), and how those numbers stack up to your Gross Potential Revenue. Directly below is a graph depicting Average Occupancy in that same period. You can select the occupancy chart to show your Standard or Actionable occupancy. Standard occupancy includes all units. Actionable occupancy excludes model units and units that were down for extended maintenance.
Both sections work in tandem, so you can use your cursor to hover over either graph and see a breakdown with the actual numbers of your Community Rent Revenue, Gross Potential Revenue, and Average Occupancy for any given month. In the upper right corner, you can change the time frame of the data included and select if you want the graph to display your TTM Rent Revenue data.
The Unrealized Floorplan Rent Revenue provides an additional layer of context in performance by displaying the difference between actual and potential revenue by floorplan. You can choose which month's data you'd like to see and can also choose to view data by bedroom configuration or expand the table to show each floorplan's performance individually.
The Rent Analytics Page
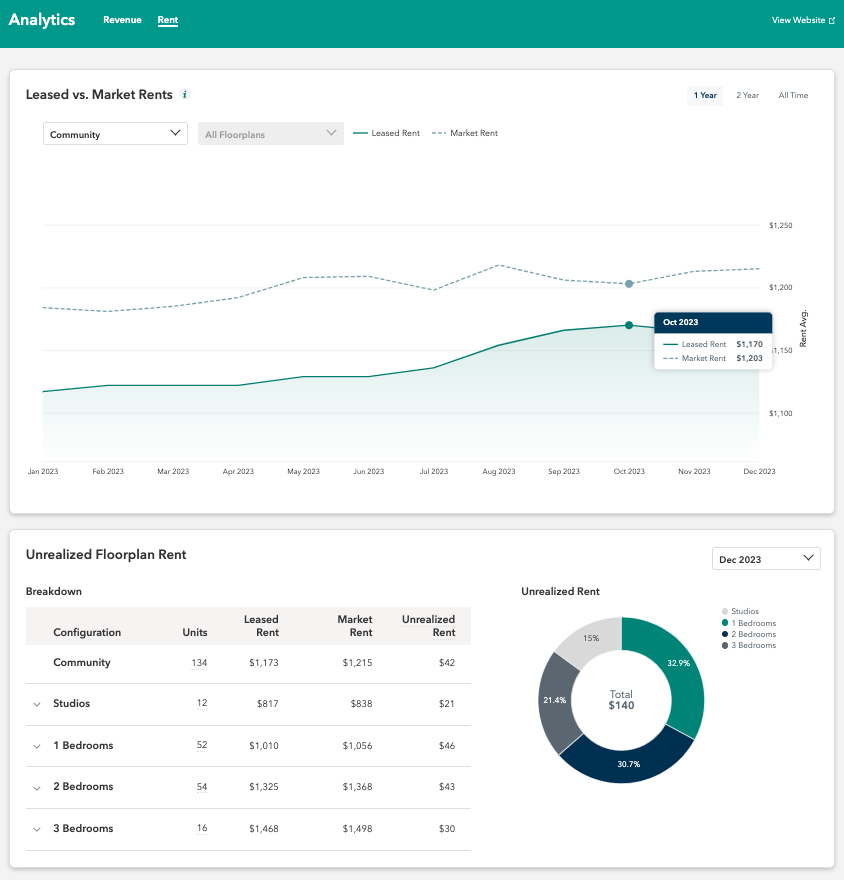
The Rent Analytics page, which is accessible via the Revenue section of the RentVision Platform next to the Revenue Analytics page, breaks down your pricing performance.
The Leased vs. Market Rents table displays your average monthly rent charge (leased rents) incurred for the month, whether paid or unpaid, compared to the average market rent for all units. You can filter the data by bedroom configuration or individual floorplan, as well as change the timeline of the data displayed. You can also use your cursor to hover over the lines in the graph to see a pop-up that details the actual amount of your leased and market rent averages.
Further below the page is the Unrealized Floorplan Rent graph breaking down the average additional amount per unit—by configuration or individual floorplan type—that would have been charged if all units leased at the current Market Rent. You can also choose which month's data you'd like to see.
Simply put, the Revenue and Rent Analytics pages will help you track the progress toward achieving your defined asset objectives.
The Expirations Overview Page

The Expirations Overview offers an 18-month view of your community's expirations. You can find the overview by navigating to Leasing → Expirations → Overview. The expirations overview showcases where you have more expirations than seasonal demand where your community's occupancy goal would allow, or where you have enough traffic to allow for more expirations. The filled green bar represents the expirations you should be able to cover. Red indicates expected expirations that go beyond what a community's seasonal traffic can cover. If there's a dashed line, then seasonal traffic is expected to cover more expirations than you currently have (meaning you should be trying to renew or lease to stack expirations in that month!).
